
11 minute read • Lotto Facts & Statistics
Your Complete Guide To Lottery Statistics

Almost everyone has dreamed of winning the lottery at some time. But in a game that’s mostly based on the luck of the draw, is there any way to increase your odds?
Some people depend on the QuickPick for their lotto numbers. Others use birthdays, anniversaries, horoscopes or lucky numbers to fill in those blanks. Then there are those who want a little more assistance to ensure that their number combination is the perfect one, hoping to increase their odds of winning the lottery using statistics.
While it doesn’t guarantee you a win, learning the statistics for your favourite lottery might give you a competitive edge the next time you go online to fill out your numbers. So, if you’re looking for the scoop on how to statistically win the lottery, want to know what your chances of winning the lottery are or have just never heard of lottery statistics before and are ready to learn more, our team is ready to help! We’re going to look at some of the most useful lottery statistics in Australia and tell you all you need to know about using them the next time you buy lotto tickets.
This Thursday $12 Million

What are the chances of winning the lottery?
The first and most important statistic you’re probably interested in is this: just what are your chances of winning the lottery?
They’re low. But that doesn’t stop people from trying!
Of course, there are lower-tier prizes that are easier to obtain than the elusive jackpot, but that doesn’t mean that any of your lotto tickets will net you even the smallest win. That’s why it’s not a good idea to treat the lottery as a money-making scheme. Instead, you should look at it as a means of entertainment, and never bet more than you can afford to lose.
Are lottery statistics worth the work?
If you’re reading this, then chances are you’re wondering if betting on lottery statistics is worth all the work you’ll have to put in. The truth is that most of the work is already done for you. So why not give it a go?
Many lottery players believe that winning the jackpot is all about luck — and to some extent, that’s true because lotteries are completely random and unconnected. There’s no way to predict a winning combination, no matter how good your math skills may be. So, it’s true that luck and good timing pay for themselves, but having a mathematical strategy in mind when placing bets won’t hurt your chances.
So, how exactly can utilising statistics contribute to better odds of winning the lottery? Let’s see.
1. Lottery statistics can help you discover your probability of winning
Oftentimes, the lotteries with the biggest jackpots come with the worst odds. Take the U.S. MegaMillions, for example — jackpots usually add up to hundreds of millions of dollars, but the odds of winning are 1 in 302.5 million.
In contrast, the popular Oz Lotto jackpot starts at $2 million (though it often increases thanks to rollovers), and the odds of winning are only 1 in 45.4 million. By contrast, the minimum jackpot for Monday Lotto may only be $1 million, but you have a 1 in 8 million chance of winning. So you can see that simply studying statistics regarding jackpot odds will help you make better choices about the lotteries you enter and increase your odds of potentially scoring a prize.
When choosing a lottery, jackpot odds aren’t the only thing to consider, either. Lottery statistics prove that entering lotteries with a smaller number pool (i.e., lotteries that choose numbers between 1-30 instead of a lottery that chooses numbers between 1-45) can increase your chances of hitting the right combination. Likewise, lotteries that require fewer number picks (i.e., lotteries in which you only must pick five numbers rather than seven) will do the same. Choose your lottery wisely, and you’re much more likely to win!
2. Online lottery statistics can help you choose more likely numbers
Many lottery players choose their numbers randomly — but what if there were a better way? You may be able to boost your probability of winning the lottery via statistics by discovering which number combinations are more likely to be drawn and which ones are a far shot.
Let’s look at an example with a 5/69 lottery.
The chances of winning with an all even or all odd combination (i.e., 2 – 4 – 6 – 8 – 10, etc.) is much less likely than winning with a combination of even and odd numbers (i.e., 2 – 7 – 13 – 8 – 24, etc.). Similarly, the chances of winning with a combination that is made up of all low or high numbers (i.e., 1 – 2 – 3 – 4 – 5, etc.) is much less likely than winning with a combination of both high and low numbers (i.e., 7 – 39 – 22 – 41 – 65, etc.). The same goes for numbers that are all the same group (i.e., 11 – 19 – 18 – 13 – 12) because such a combination is very unlikely to occur.
Why? These combinations are less likely to occur, simply because there are fewer possible combinations. Think about it — how many combinations can you make with numbers that only end in nine or are only single digits? Compare that to how many combinations you can make by using an equal number of odds or evens or an equal number of highs and lows.
This Thursday $12 Million
Entries Close:0 Hrs0 Min0 Sec
3. Lottery statistics can help you make more savvy choices
Knowing how to play the lottery wisely is not only a part of responsible gaming online — it also increases your chances of winning in the long run. One such way is by using the stats to know when to play.
Statistics make it clear that the more entries you have in a certain drawing, the more likely you are to win something. Let’s look at Oz Lotto for an example.
You have a 1 in 45,379,620 chance of winning the Division 1/Jackpot prize if you purchase one ticket. But if you enter another ticket with a different number combination, your odds immediately become 2 in 45,379,620.
So, is the solution to just buy as many lotto tickets as you can afford? Definitely not. Rather, instead of buying a ticket every week, you might consider saving your lotto money for a few weeks and then buying several tickets for the same drawing instead.
Doing the maths: how to calculate lottery statistics
Each lottery has a unique set of statistics that comes from the number pool players pick from, as well as the number of picks a player must make. This makes it possible to calculate the odds for yourself (though most sites will do it for you). Let’s learn how to do it.
Step 1: Identify the numbers you’ll need to know
In this case, it is the range of balls and the number of picks.
Step 2: Use the binomial coefficient formula to determine the total possible =number of combinations
The formula looks like this:
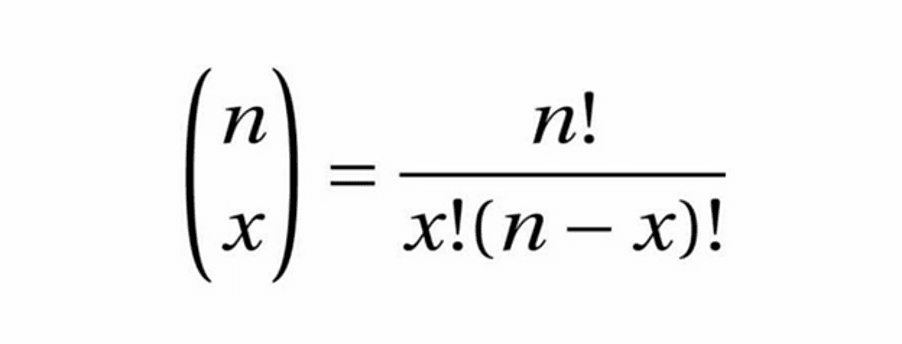
And, no, the exclamation point doesn’t indicate excitement! It’s actually called factorial. It means that you multiply the number by every consecutive number. For example, 5! really means 5*4*3*2*1 or 120.
For this equation, you’ll be substituting the two numbers from step one for variables n and x; n = the range of balls and x = the number of picks.
Let’s turn to our 5/69 lottery example to see what this will look like.
Here’s the original formula:
69! / 5! (69 – 5)!
And when the same formula is written out further:
69 * 68 * 67 * 66 * 65 * 64! / 5 * 4 * 3 * 2 * 1 * 64!
And because 64! is present in both the upper and lower parts of the equation, it cancels itself out, and the formula becomes:
69 * 68 * 67 * 66 * 65 / 5 * 4 * 3 * 2 * 1
Now we input this equation into our handy calculator, and we get the answer of:
1,348,621,560 / 120
Or, in other numbers, 11,238,513.
Therefore, your odds of winning the jackpot by playing a lottery with a 5/69 format are 1 in 11,238,513.
Step 3: Determine the odds of winning with any supplementary numbers
But what if your chosen lottery game uses Powerballs or other supplementary numbers? Not to worry — figuring out those odds is simplicity in and of itself. You simply use the same formula, but for those additional picks and ranges.
So, let’s say that you must choose one additional ball out of a pool of 26. According to the binomial coefficient formula, you would simply divide 26! by 1! * (26! – 1!). This would end up being simply 26 divided by 1, or 26. Therefore, there are 26 possible combinations of 1 number chosen from a pool of 26.
Step 4: Multiply all combinations together
To find out the overall odds for a certain prize level, we must multiply our two previous answers (26 * 11,238,513) together. The outcome is 292,201,338.
Step 5: Divide the number of winning outcomes by the number of total outcomes
Of course, there may be almost 300 million total combinations, but that doesn’t mean they are all the winners. To find your final probability, you must divide the total number of winning combinations — which will always be 1 — by the total number of possible combinations from step 4.
Therefore, your final odds are 1 in 292,201,338. Incidentally, these are the same odds for winning U.S. Powerball.
If you know the range of balls, the number of picks you must make and the number of correct picks needed to win a certain prize, you can use this guide How to Calculate the Probabilities of Winning the Nine PowerBall Prize Levels? to learn more about the odds for any lottery and prize tier.
How to pick lottery numbers using statistics
So, you want to know how to statistically win the lottery? Some might say it’s impossible.
Many lottery players pick their numbers based on past winning combinations or other superstitions, but it’s important to remember that every lottery drawing is independent of the ones that came before. This means that even if a number has been (or hasn’t been) picked recently, it can still be picked again!
Despite the independence of lottery draws, lottery statistics are not entirely unhelpful and can still be helpful when picking lottery numbers. We’ve already discussed some of the ways in which you can use lotto statistics to increase your odds of winning, but here are a few more tips to keep in mind.
- Pick your numbers based on compositions that are likely to get picked. Don’t choose number sequences that are less likely to be chosen, simply because they look nice together — for example, don’t choose number patterns, numbers with a similar ending or starting digits, etc.
- Remember that hot and cold numbers (numbers that are drawn more or less frequently, respectively) don’t guarantee that the number will or won’t be chosen.
- Use a mixture of odd and even numbers as well as low and high numbers — it’s unlikely that a winning combination of numbers will all belong to the same group.
- Don’t give up after failure! Persistence is usually the key for lotto winners. You’re much more likely to win after playing the lotto for an extended period than you are after just a few tries.
Above all, remember that even the best statistics don’t guarantee a win. That’s what makes the lottery really random and fun!
Statistics for Australia’s favourite lotteries
Want to learn about the statistics of winning your favourite lottery? Read on below for a quick glance at what it takes to bring the jackpot home.
Powerball in Australia
After being revamped in 2018, Australian Thursday Powerball now draws seven numbers from a pool of 35 and incorporates an additional Powerball from a separate number pool of 20. This gives players nine chances to win.
| Prize | How to win | Probability of winning |
| Division 1/Jackpot | Match 7 + Powerball | 1 in 134,490,400 |
| 2nd division | Match 7 | 1 in 7,078,443 |
| 3rd division | Match 6 + Powerball | 1 in 686,176 |
| 4th division | Match 6 | 1 in 36,115 |
| 5th division | Match 5 + Powerball | 1 in 16,943 |
| 6th division | Match 4 + Powerball | 1 in 1,173 |
| 7th division | Match 5 | 1 in 892 |
| 8th Division | Match 3 + Powerball | 1 in 188 |
| 9th division | Match 2 + Powerball | 1 in 66 |
Oz Lotto
This lottery has been around since the 1990s, and it’s only grown in popularity. With a minimum jackpot prize of $2 million and frequent jackpot rollovers, Oz Lotto offers some of the biggest prizes in the world of Aussie lotteries. It’s played with nine balls drawn from a pool of 45, the first seven balls being used as the winning numbers and the last two being supplementary numbers which are used for certain prize pools.
| Prize | How to win | Probability of winning |
| Division 1/Jackpot | Match 7 | 1 in 45,379,620 |
| 2nd division | Match 6 + supplementary ball | 1 in 3,241,401 |
| 3rd division | Match 6 | 1 in 180,078 |
| 4th division | Match 5 + supplementary ball | 1 in 29, 602 |
| 5th division | Match 5 | 1 in 3,430 |
| 6th division | Match 4 | 1 in 154 |
| 7th division | Match 3 + supplementary ball | 1 in 87 |
Other popular online lotteries
| Lottery | Jackpot | Probability of winning |
| Oz Lotto | Minimum $2 million | 1 in 45,379,620 |
| Australian Powerball | Minimum $4 million | 1 in 134,490,400 |
| Monday Lotto | Minimum $1 million | 1 in 8,145,060 |
| Wednesday Lotto | Minimum $1 million | 1 in 8,145,060 |
| Saturday Lotto | Minimum $5 million | 1 in 8,145,060 |
| Set for life | $20,000/month over 20 years | 1 in 38,320,568 |
Feel like taking your chances on the lotto now? If you’re ready to implement your new skills with lottery statistics in Australia lotteries, be sure to visit our Oz Lotteries site or Oz Lotteries app for easy and convenient access to some of the best lotteries Australia has to offer.
Good luck!
Our latest articles about: